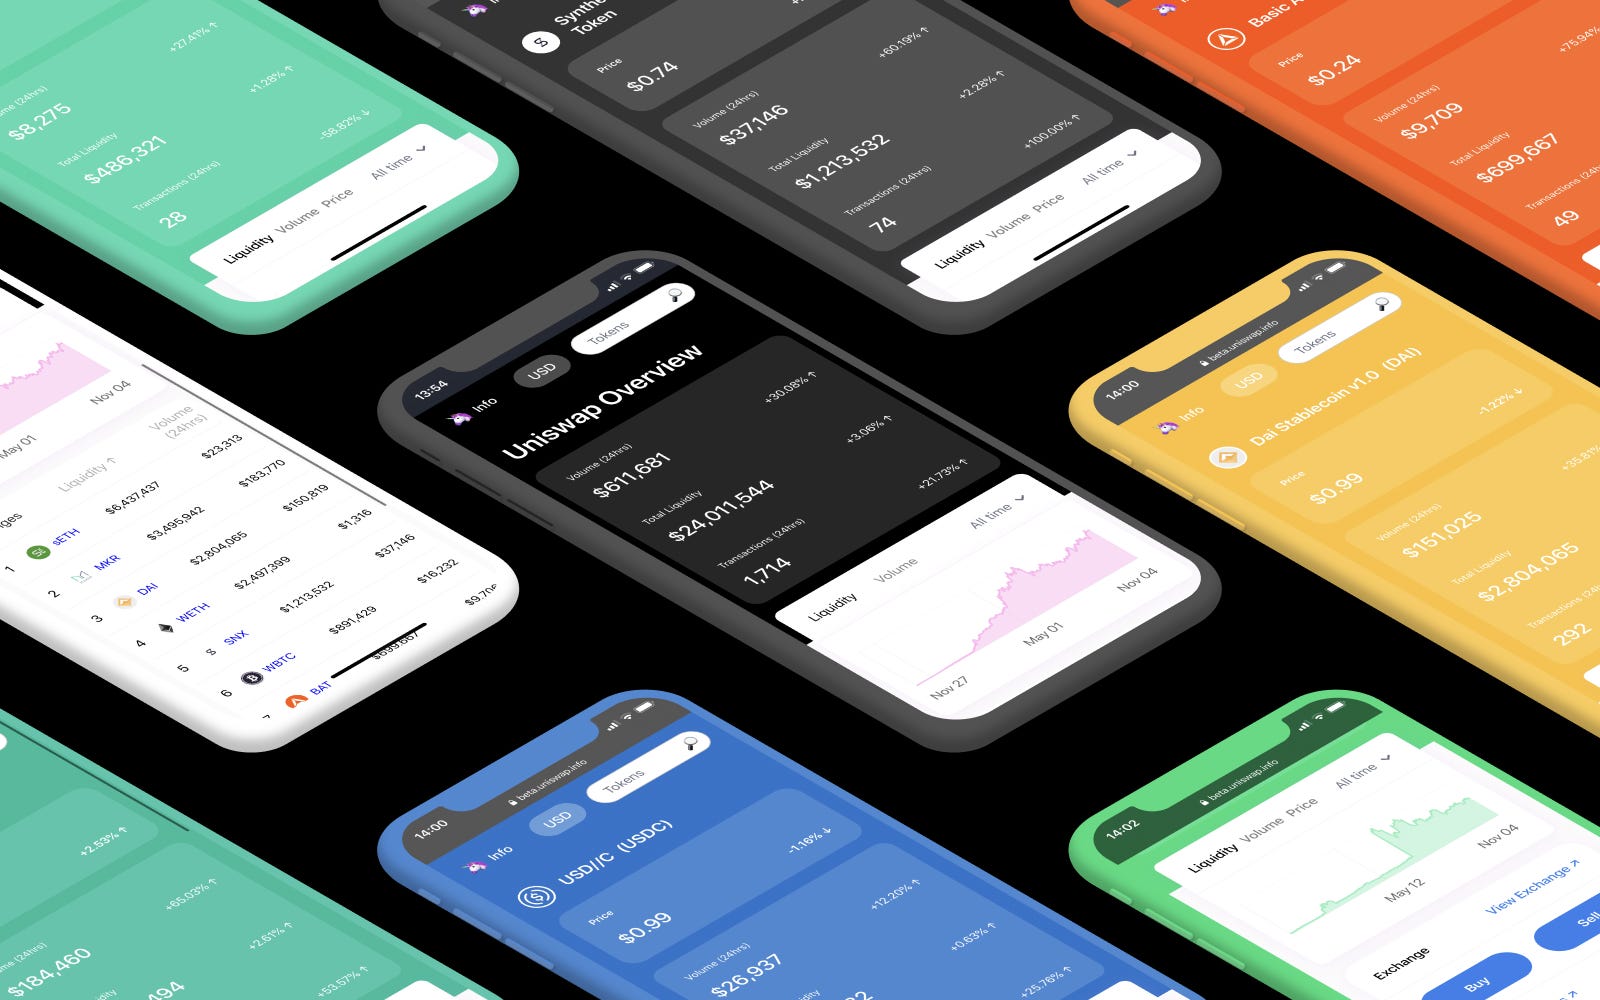
We’re excited to release a new and improved Uniswap.info with more detailed information about the Uniswap ecosystem and token exchanges. For this release we focused providing more complete and accurate data, better UI/UX and the ability to buy and sell tokens with the Uniswap iframe integration.
Keep reading below for a breakdown of the new features.
Overview Page

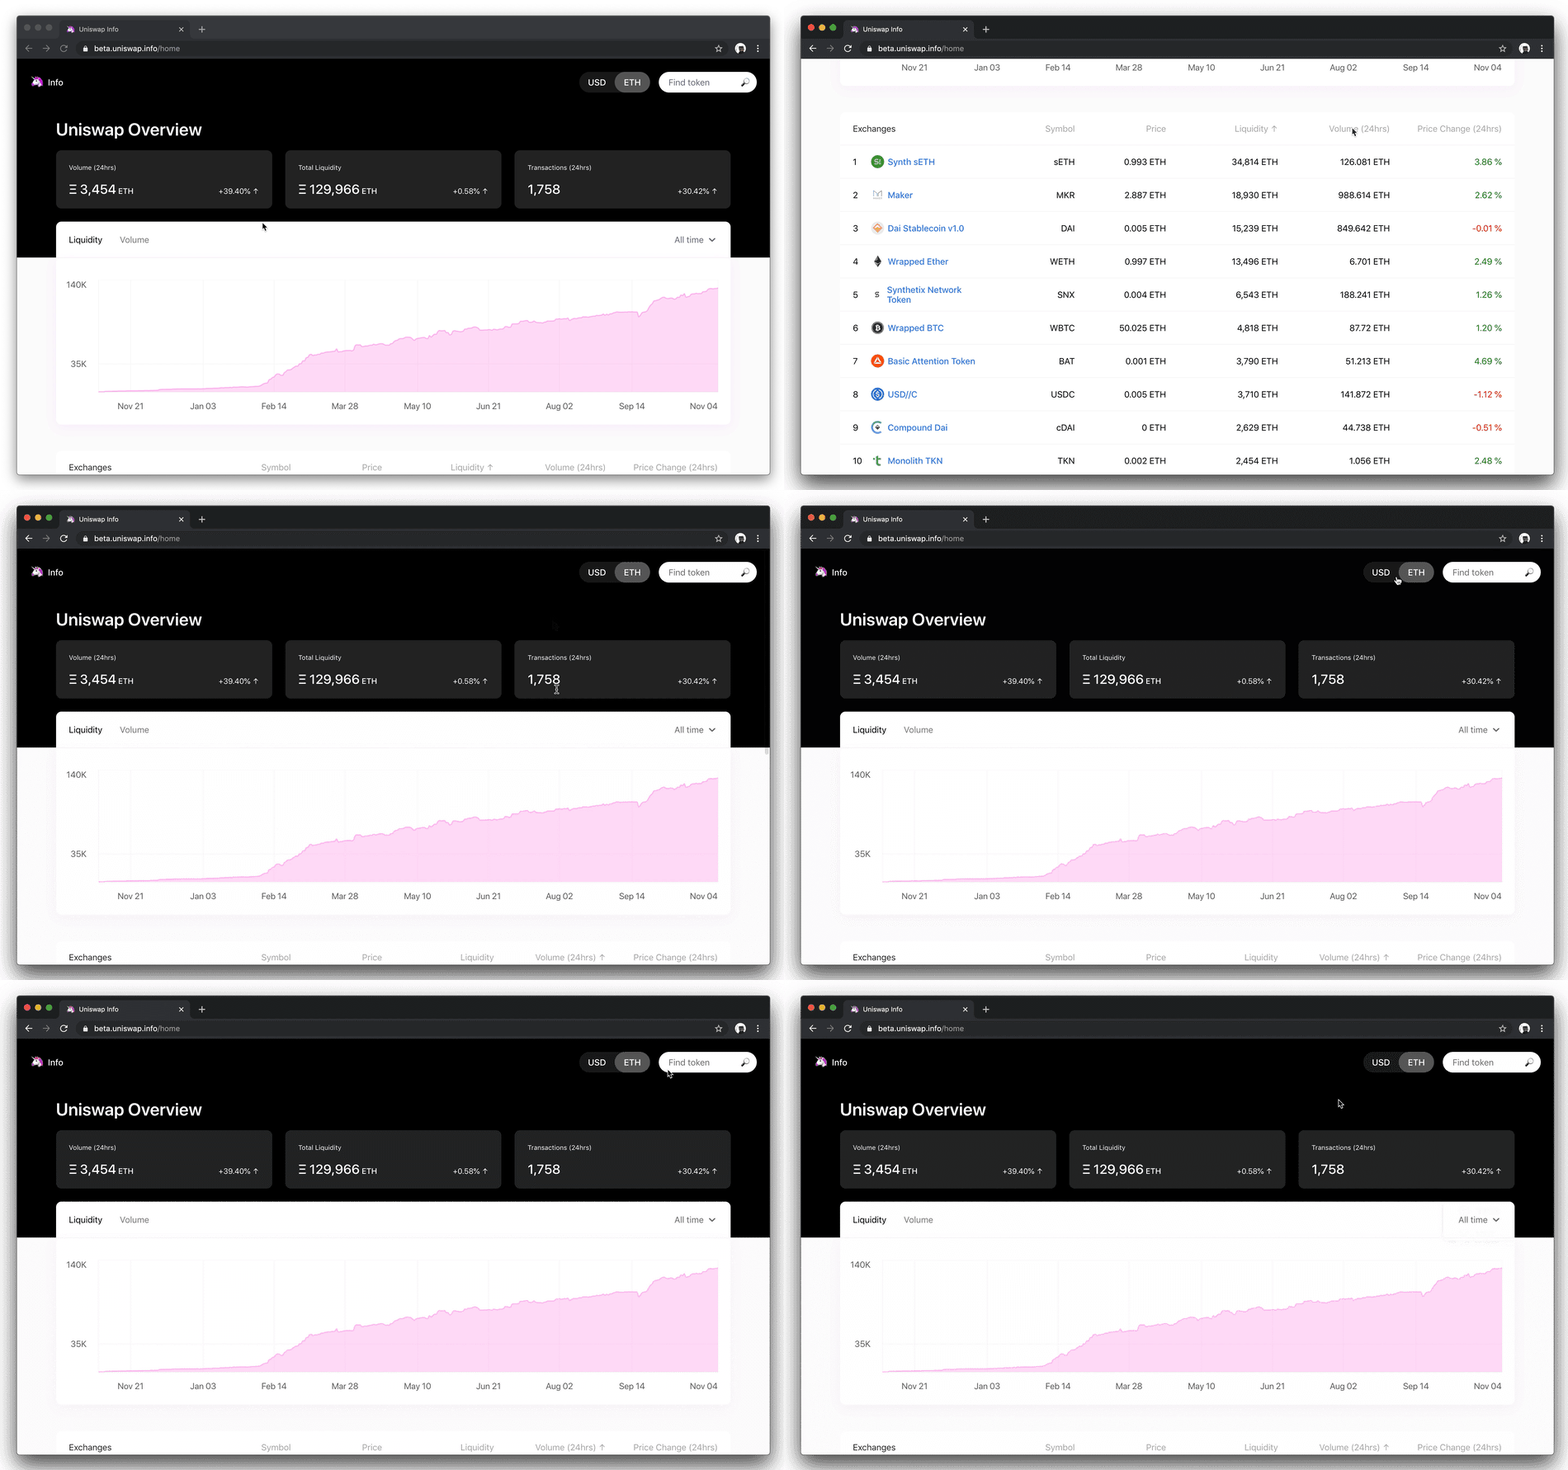
We’ve built a new overview page with high level data about exchanges on Uniswap. Detailed stats like 24 hour volume, total liquidity and daily transactions are now available at a glance. We’ve also listed the top exchanges sortable by price, volume, liquidity and more to help you explore different aspects of the most active pools.
Exchange Pages

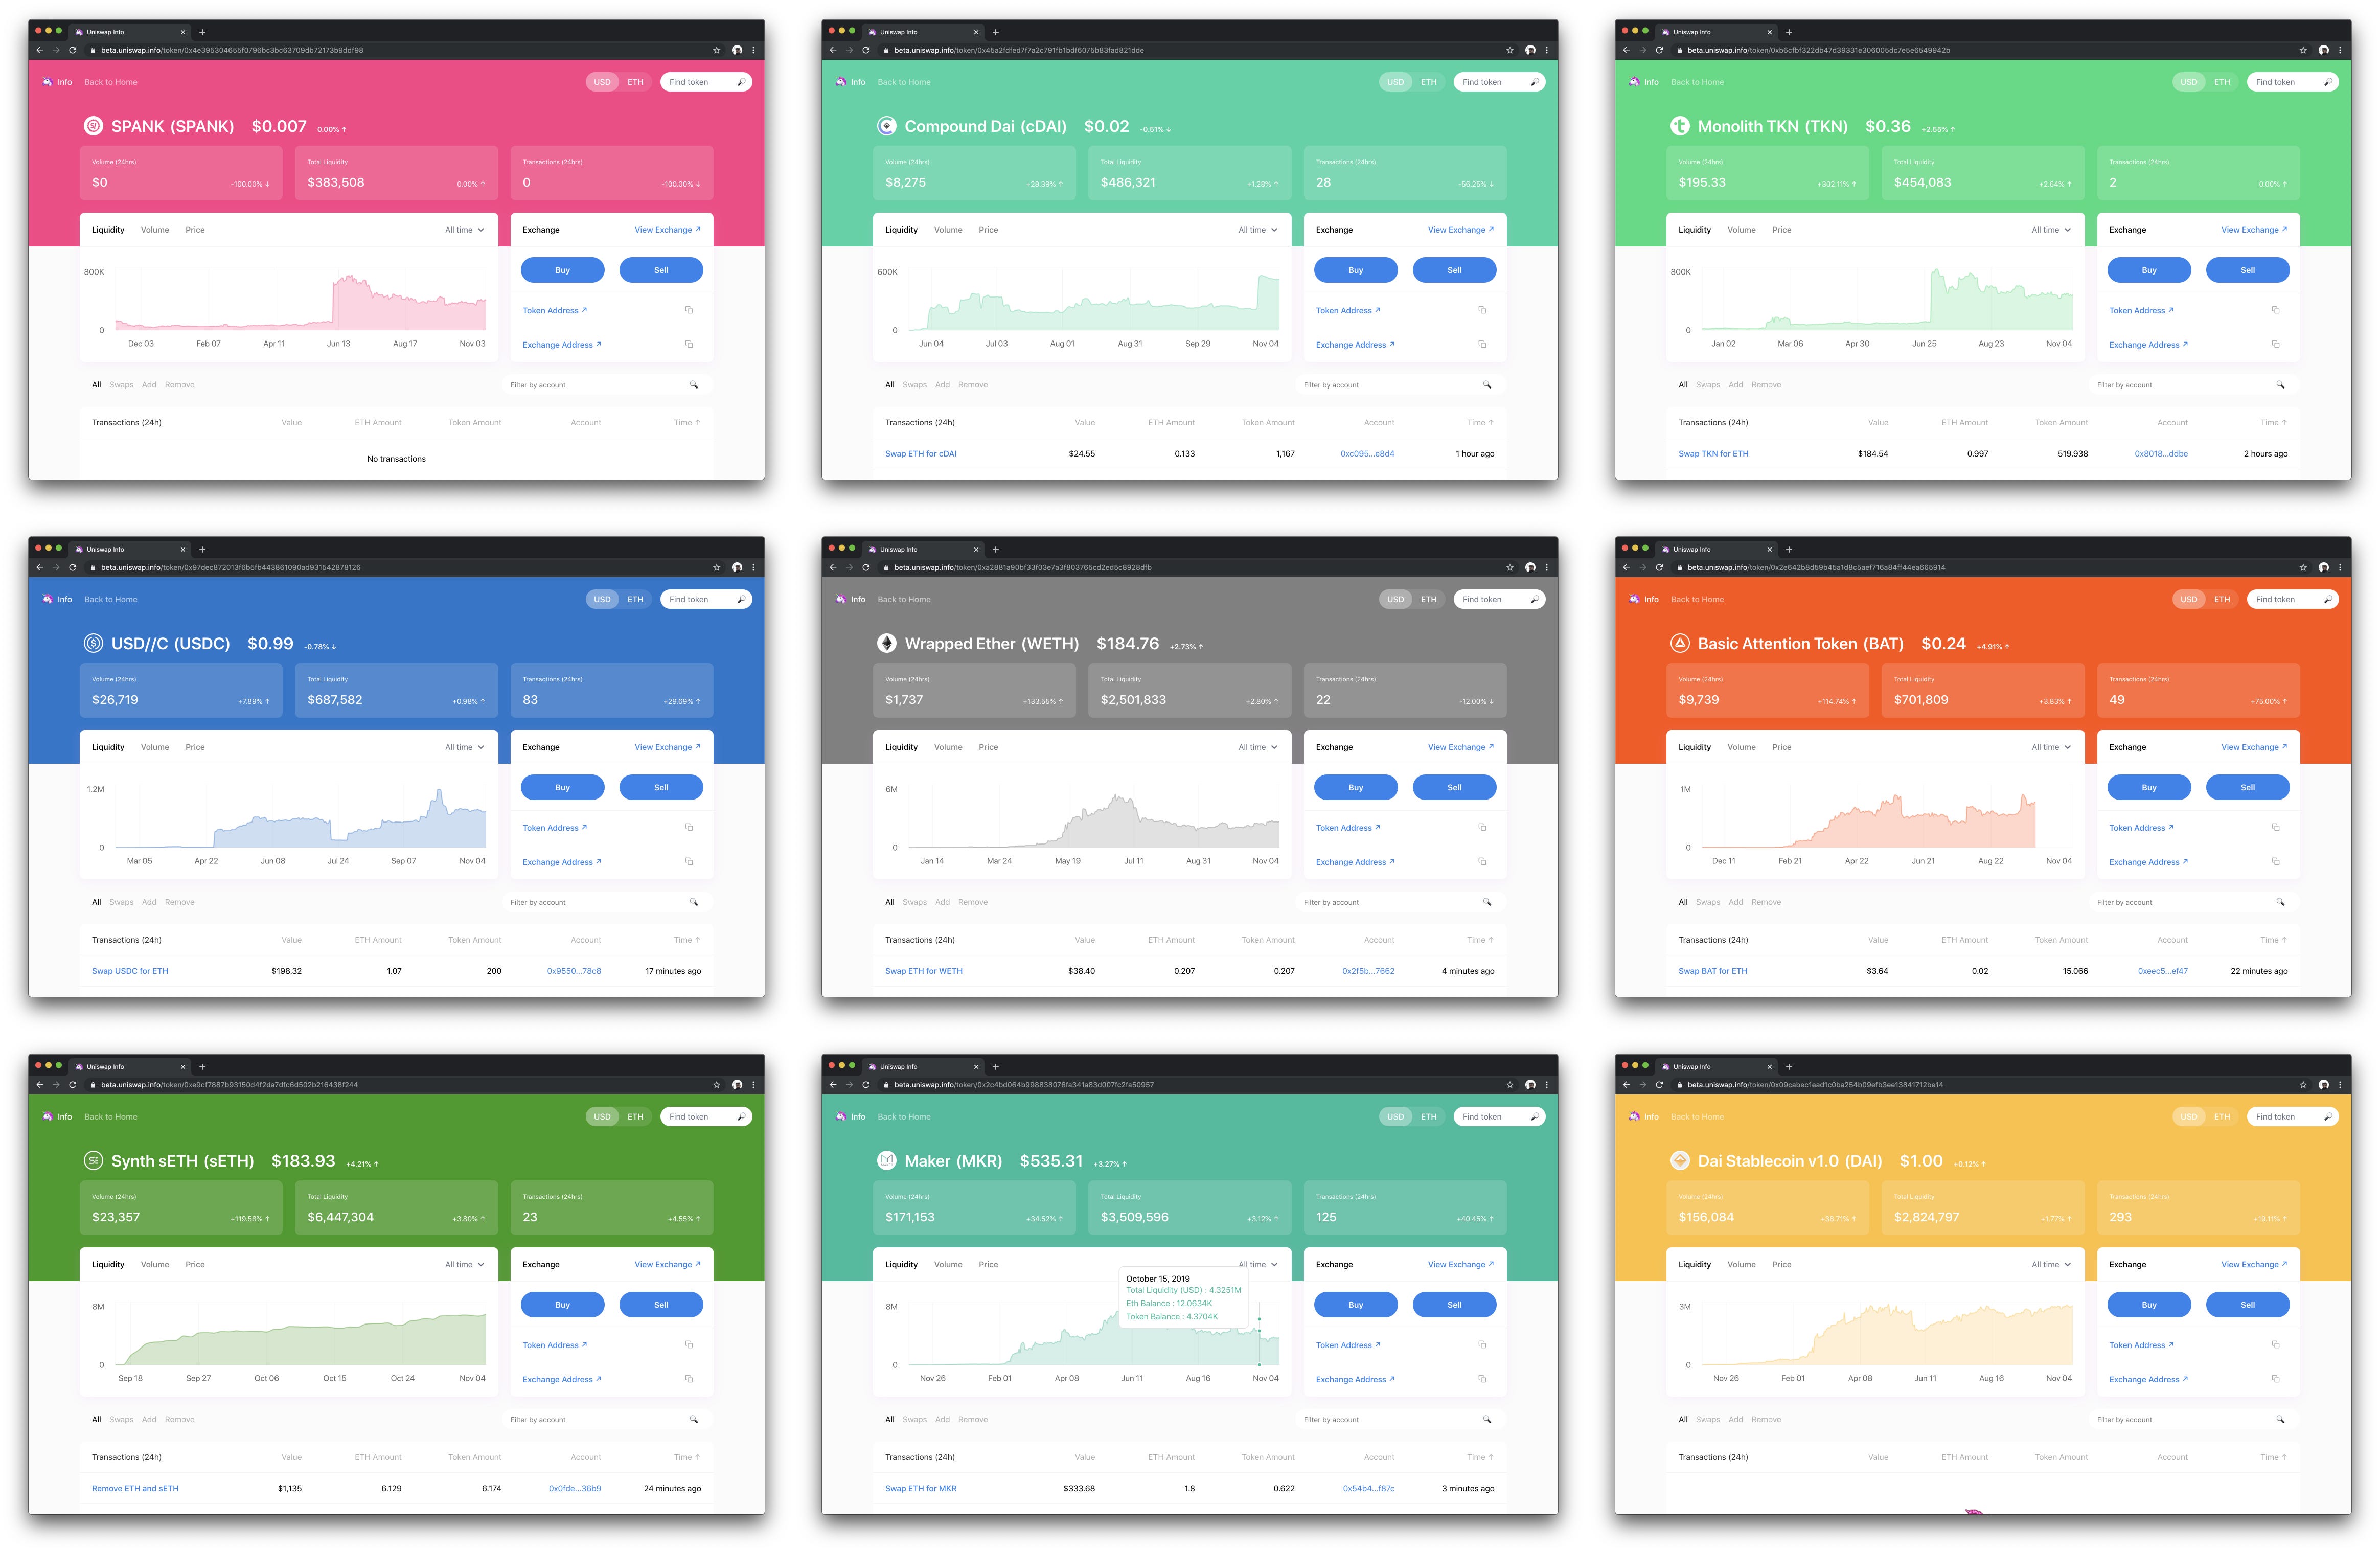
We’ve updated the design to give you a better overview of the exchange price and performance including 24 hour stats in USD and ETH. The chart view has been improved and shows historical liquidity, volume and price across across a number of timeframes.
We now show a sortable and filterable list of of all transactions in the last 24 hours as well.
Buy any token using Uniswap.info

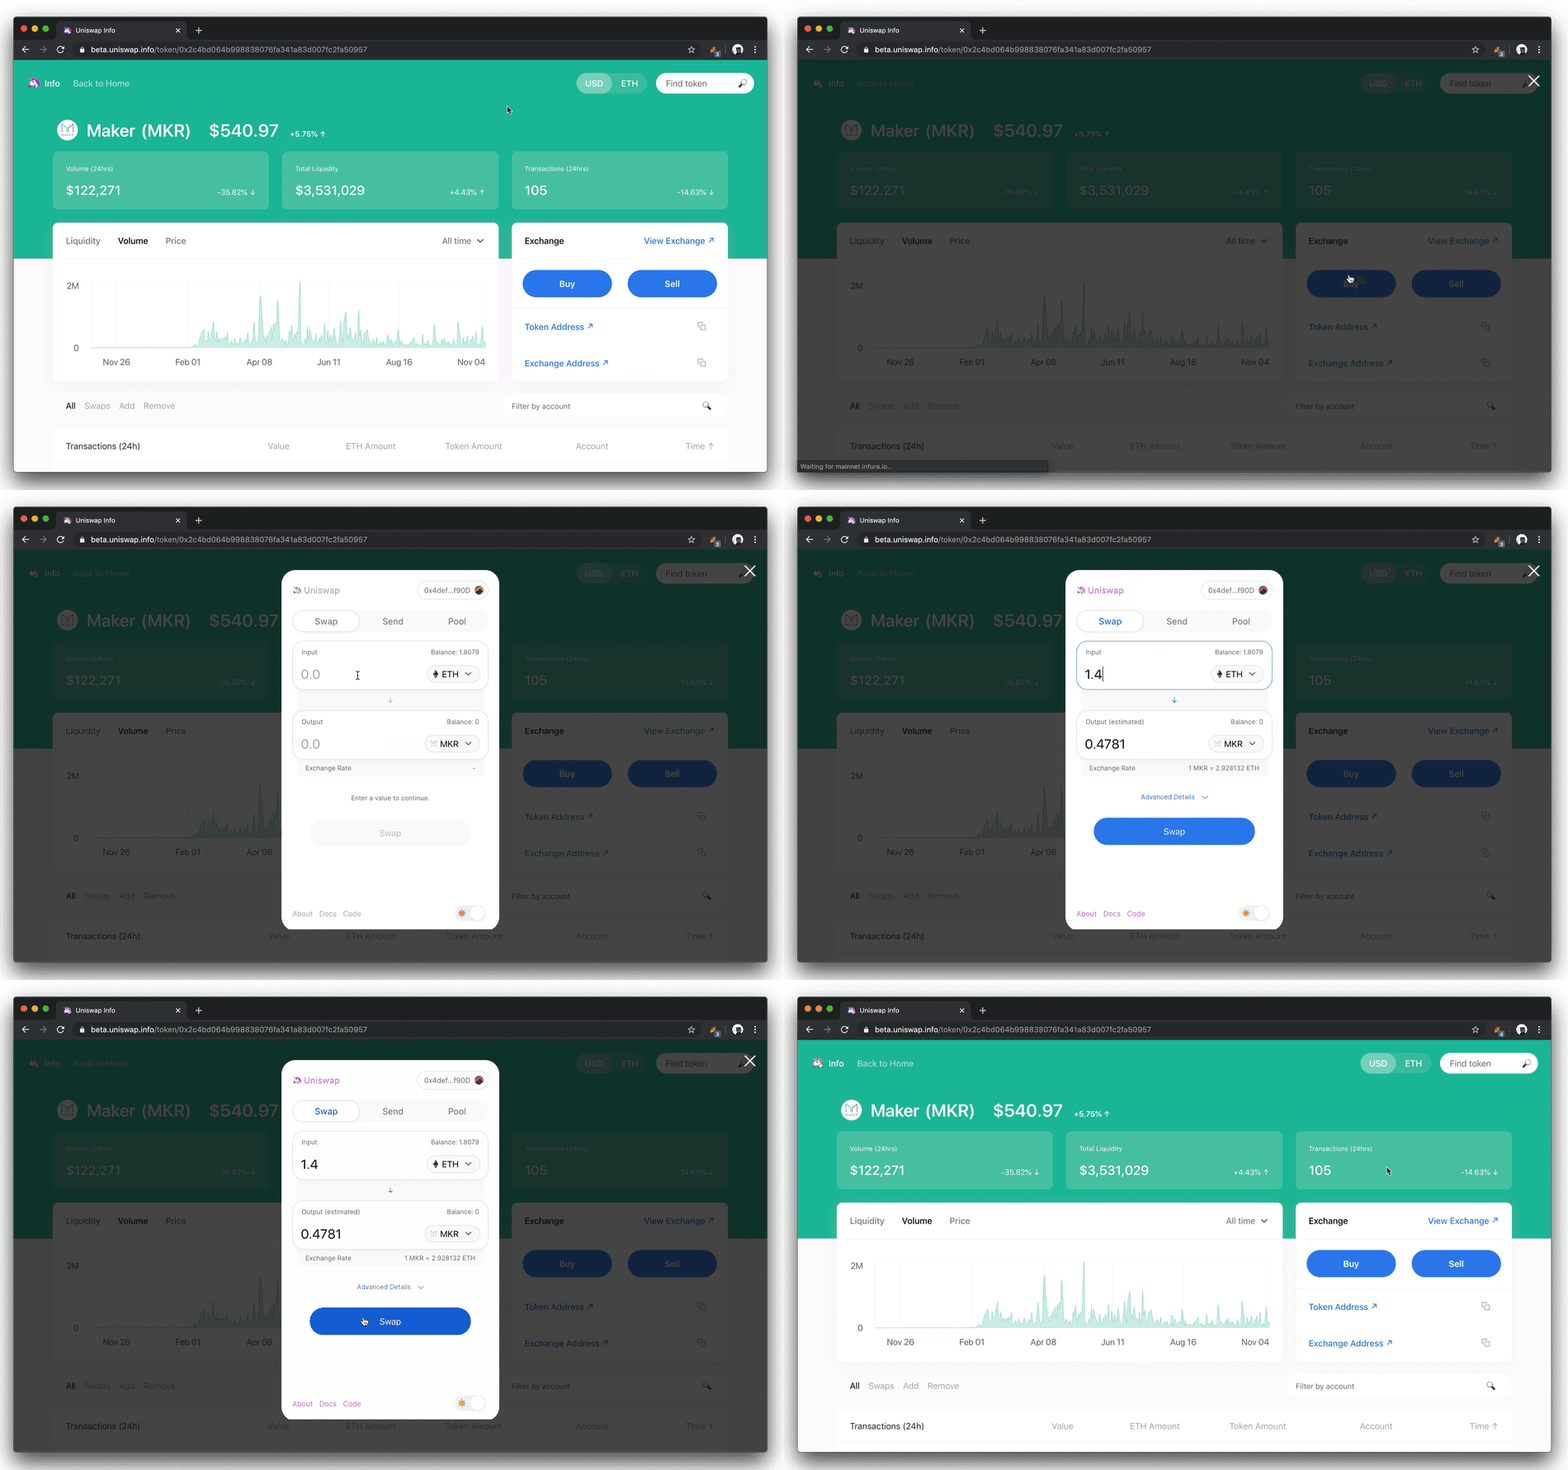
Using a Uniswap.exchange iFrame integration, you can now directly buy and sell any token from the exchange info page. If you are a hardcore DAI trader you might consider bookmarking this page for a one stop shop for data, analytics and trading.
Uniswap.info automatically shows all tokens on the Uniswap protocol as long as there is at least 0.1 ETH in liquidity. This means it can be used to trade tokens that are not shown on the default list of Uniswap.exchange. We highly recommend you verify the address of any tokens traded.
If you’re interested in doing something similar on your site, you can read more about how to embed uniswap.exchange)
Linking
Analytics for a specific pool can be linked to directly using the tokens address.
https://uniswap.info/token/0x89d24a6b4ccb1b6faa2625fe562bdd9a23260359
Data!
The updated Uniswap.info was built using data from The Graph. We’ve worked closely with The Graph team to upgrade the Uniswap subgraph to support for better views, historical data and transactions. We’ve added historical data for Uniswap as a whole with daily volumes and liquidity over time.
If you are building a uniswap data tool you may consider building off the new subgraph.
UI and UX polish
Along with a fresh coat of paint, we’ve updated the UI to better support denser data views and a consistent layout that flexes smoothly to a mobile view. All the prices denominated in ETH can now be swapped for USD with a toggle in the top right and we’ve cleaned up the units across the site.
The charts are now easier to read and have a tab view to switch between data and each token page will now extract a color from the token to apply a unique style.

Upcoming Features
We’ve got a lot planned for this site in the future…
Liquidity Provider specific pages and support
Data around holdings, ROI, etc
Data export (CSV)
Top LPs
Top performing pools
Live data for transactions and prices
More statistics, rankings, insights
Exchange health statistics
If you have any ideas for things you’d like to see that isn’t on this list we’d love to hear feedback.
If you are looking for more Uniswap analytics tools check out https://github.com/Uniswap/universe for a list of tools.
You can check out the repo on github if you’d like to explore how everything works.